Approximately 5.7 million solid-walled houses exist in England, comprising 25% of the housing stock. Most were built between 1750 and 1914. Research shows that their energy efficiency has been underestimated for decades.
The English Housing Survey (EHS) defines solid-wall construction as a building where external load-bearing walls are made of brick, block, stone or flint with no cavity. In England, the shift to the use of solid-wall brick construction began during the great rebuilding from mid-16th century.
For the present English housing stock, the overwhelming fraction of solid-walled dwellings, constructed mostly of brick, derives from the expansion of population from the mid-18th century to the beginning of the First World War. Solid walls continued to be the most common construction for the domestic sector until the British housing boom of the 1920s and 1930s.
Wall Thickness
The most widely used estimate of the U-value (the measure of thermal conductivity) of a UK solid-wall property is 2.1 Wm−2 K−1. However, there is growing evidence that solid-wall U-values are much lower than previously assumed. Several studies in recent years have found that the mean or median U-values measured for solid-walled construction were around 1.3–1.4 Wm−2 K−1. There are two reasons for this large discrepancy.
First, standard solid brick wall U-values are based on an assumed wall thickness of 220 mm brick and approximately 12 mm of dense plaster. Modern bricks are 220 mm long and so this assumption would be logical for a modern brick wall. However, the thickness of 220 mm was used as a conservative estimate to capture variation in brick production. Following the Great Fire of London in 1666 brick properties over two stories were required to be constructed with walls that were more than one brick thick.
The required thickness of load-bearing masonry walls in England therefore increases with the height of the building. While two-storey buildings can be built with walls of just over 200 mm thickness, three-storey buildings require a minimum of 300 mm and four-storey buildings require walls of at least 400 mm. Consequently, it is obvious that the mean thickness of solid walls in the UK housing stock is likely to be greater than the nominal 220 mm of a single brick wall.
Air Cavities
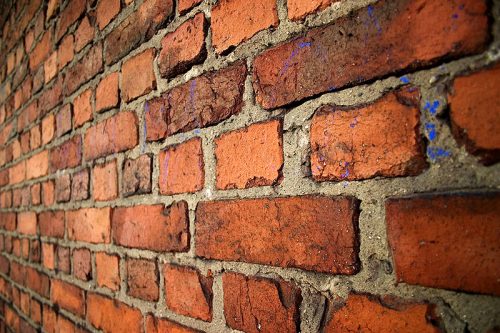
Secondly, so-called ‘solid walls’ are in fact often not completely solid. Brick walls can be built up in a variety of different patterns, but are typically constructed with a mixture of brick types, with some going straight through the full depth of the wall, known as headers, and some laid side by side, known as stretchers (see image above). In order to allow walls to be constructed with a regular type of mortar bond, the total width of two adjacent stretchers is less than the length of a header by the width of a mortar joint, which is typically 5–10 mm.
Although some mortar will intrude into the space as snots from joints between stretchers, the practical constraints of bricklaying mean that this gap is often not filled with mortar. There is a high probability that solid-wall segments built with stretchers contain air gaps. If stretchers are assumed to comprise 50–80% of the wall surface, with air gaps of the order of ≈10 mm, then a straightforward calculation with identical assumptions regarding brick density etc. yields U-value estimates in the range of 1.65–1.8 W−1 m2 K.
‘Solid’ stone walls may also contain residual air cavities for similar reasons. Walls built with stone are often thicker overall than single-brick walls and often employ rubble-filled cores. It is almost certain that there are voids within these cores that would increase the thermal resistance of the element relative to that of a completely solid wall.
Consequences
Among the many implications for policy, discrepancy between real-world U-values and U-values assumed in energy modelling and standard UK building assessment protocols suggests that standard solid-wall U-values may be inappropriate for energy certification or for evaluating the investment economics of solid-wall insulation.
Reducing the represented U-value of solid walls in the stock from 2.1 to 1.3 Wm−2 K−1 reduces the estimated mean annual space heating demand by 16%, and causes approximately one-third of all solid-wall dwellings to change Energy Performance Certification (EPC) band.
Source:
Li, Francis GN, et al. “Solid-wall U-values: heat flux measurements compared with standard assumptions.” Building Research & Information 43.2 (2015): 238-252. http://www.tandfonline.com/doi/full/10.1080/09613218.2014.967977


